
The Commodity Calendar Trade

“It was so cold today I saw a stockbroker with his hands in his own pockets“ - Attributed to Johnny Carson
Background
Okay, so I BLATANTLY STOLE came up with this idea that will hopefully have a 2+ Sharpe because I got an email from a free quant blog I subscribe to called Robot Wealth. They’re fantastic and a few of their guys have a Substack as well, check it out. I’ve read a bunch of their free content and it’s pretty neat and inspiring.
Anyway, Robot Wealth sent me an email a few months ago talking about how they shorted the BOIL (Natural Gas -2x) Leveraged ETF in the Winter months (October-December-ish?) as a strategy. The BOIL and KOLD ETFs hold the earliest-expiring- often called 1-month- Henry Hub Natural Gas Future as a position (Long and Short respectively), calculated such that Buying 1 $50 share of BOIL would mean you are long $100 of natural gas.
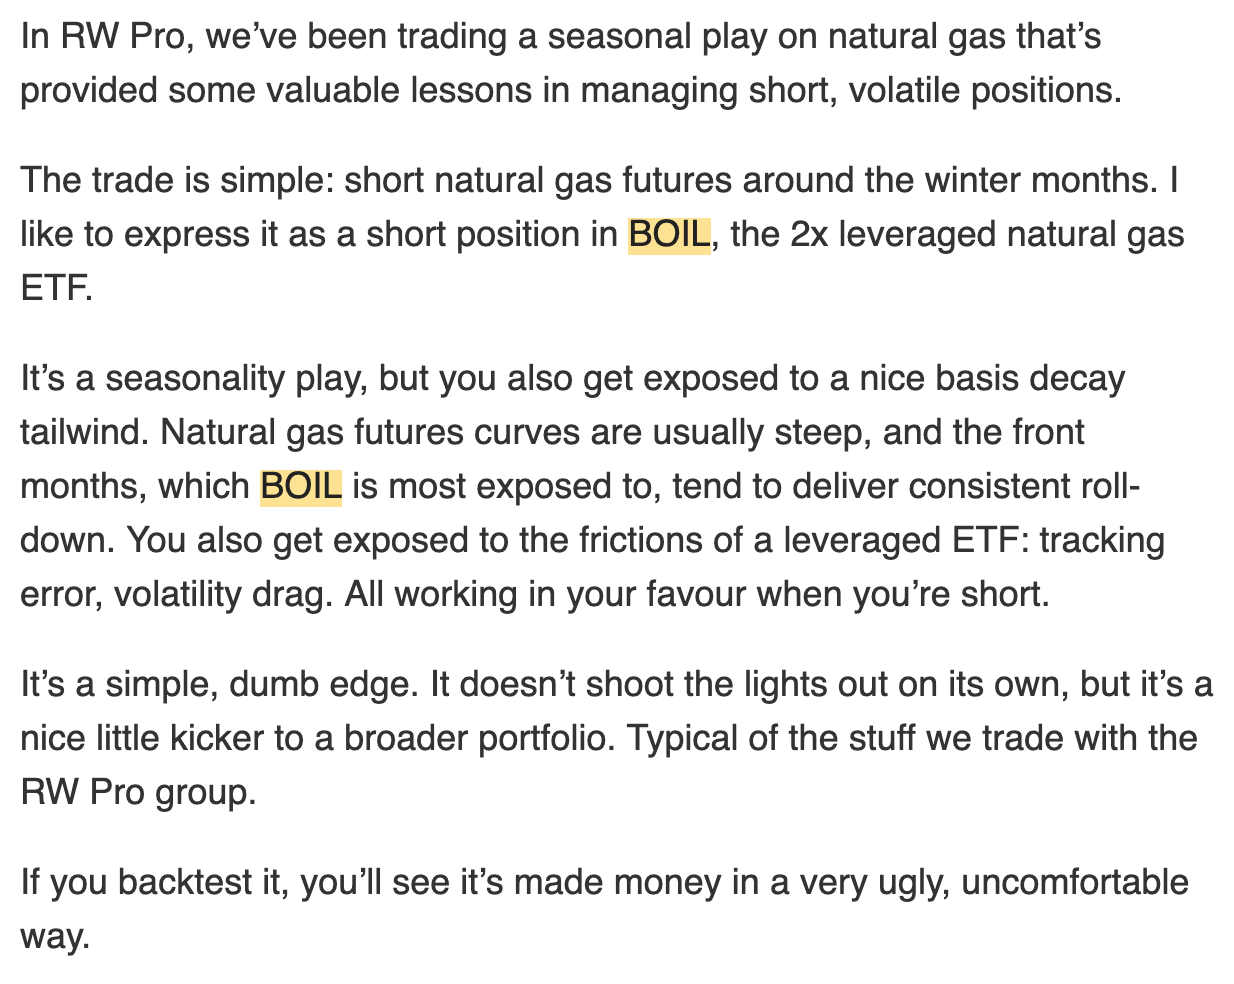
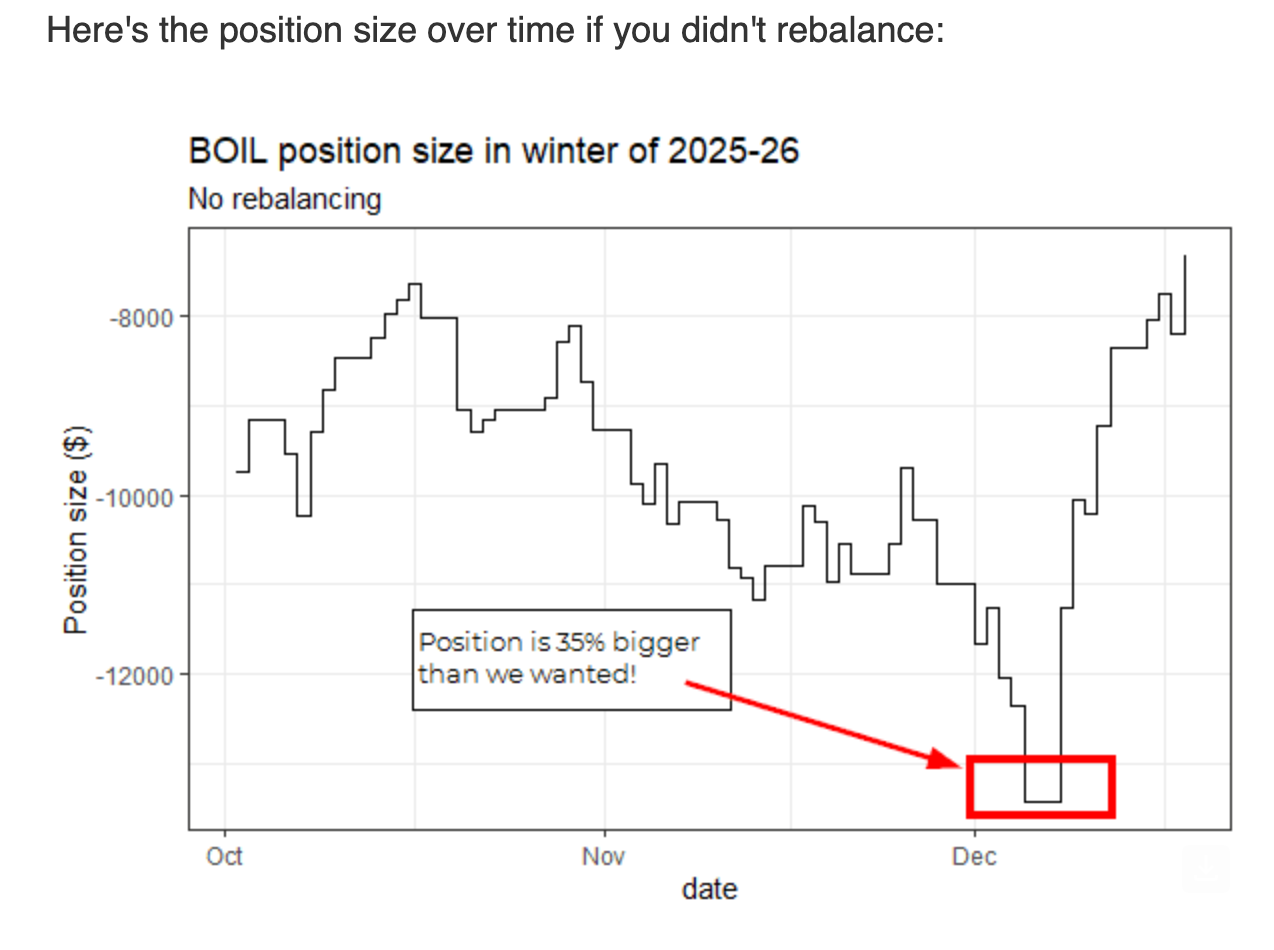
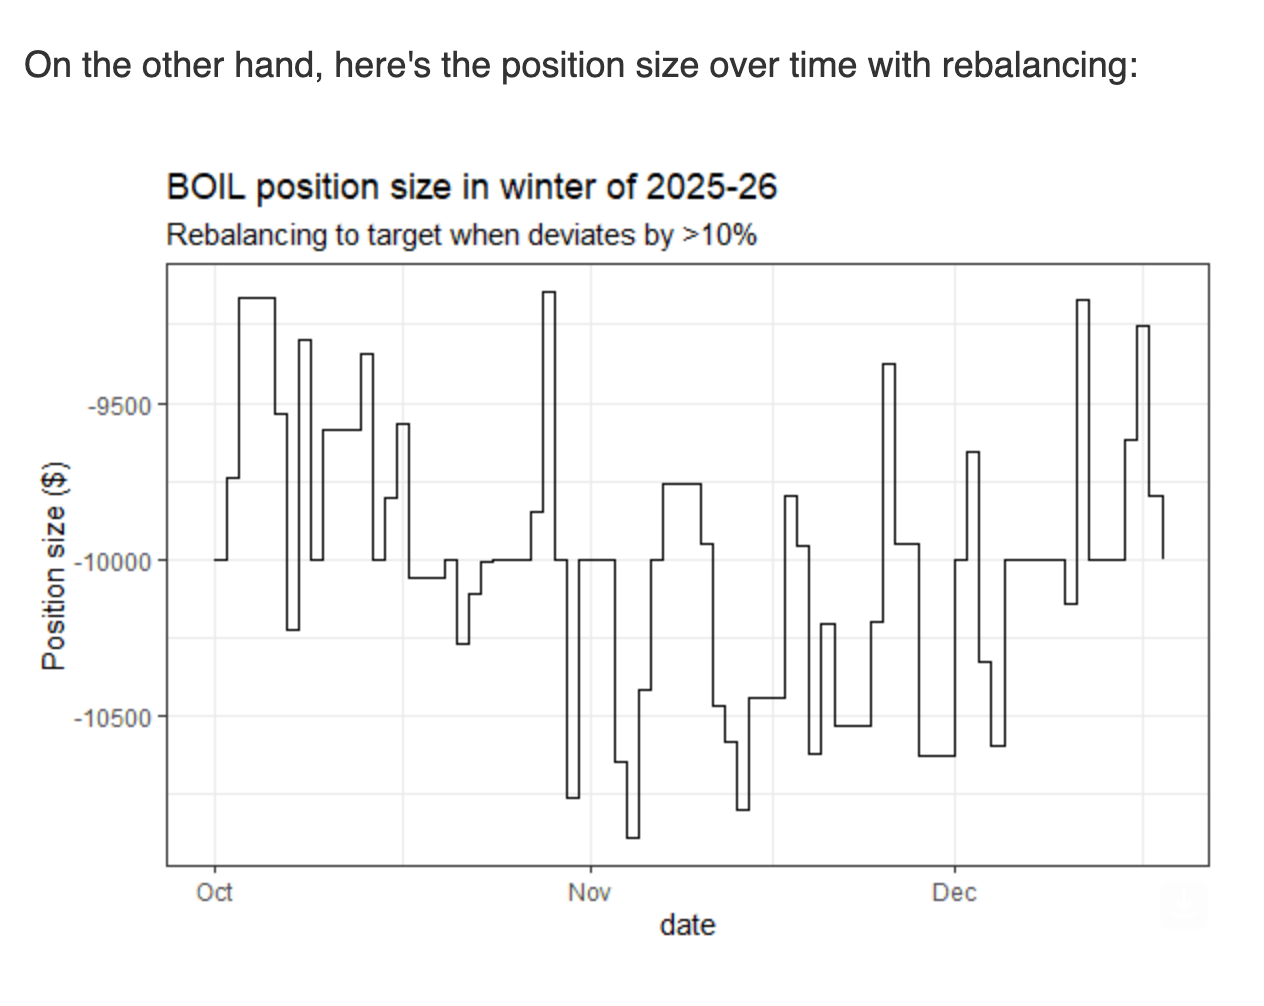
The main thrust of the email/article was how to handle a volatile short position, and the counterintuitive smarts of buying back shares and taking losses as the position moves against you. As well as selling more shares short when the position swings the other way. This is really important, because while a long position moving against you is annoying, a short position moving against you can be catastrophic.
But…
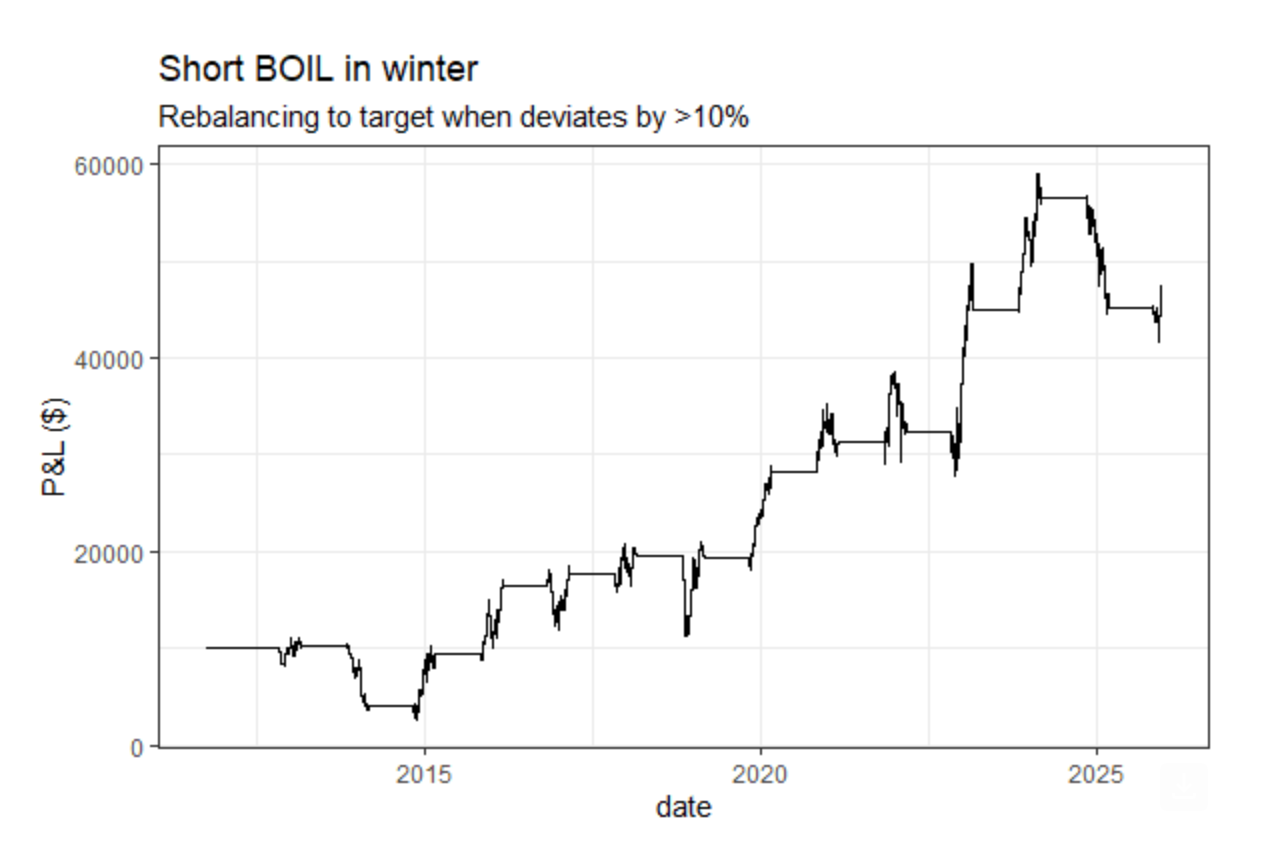
But I looked the trade backtest, and I thought... All the returns on that chart seem to come from December, why are they trading this for 3-4 months and taking on risk and shorting fees instead of only trading during December?
So I did a backtest with some yfinance data and separated the returns out by calendar month.
Lo and behold! KOLD and BOIL have some interesting monthly dynamics.
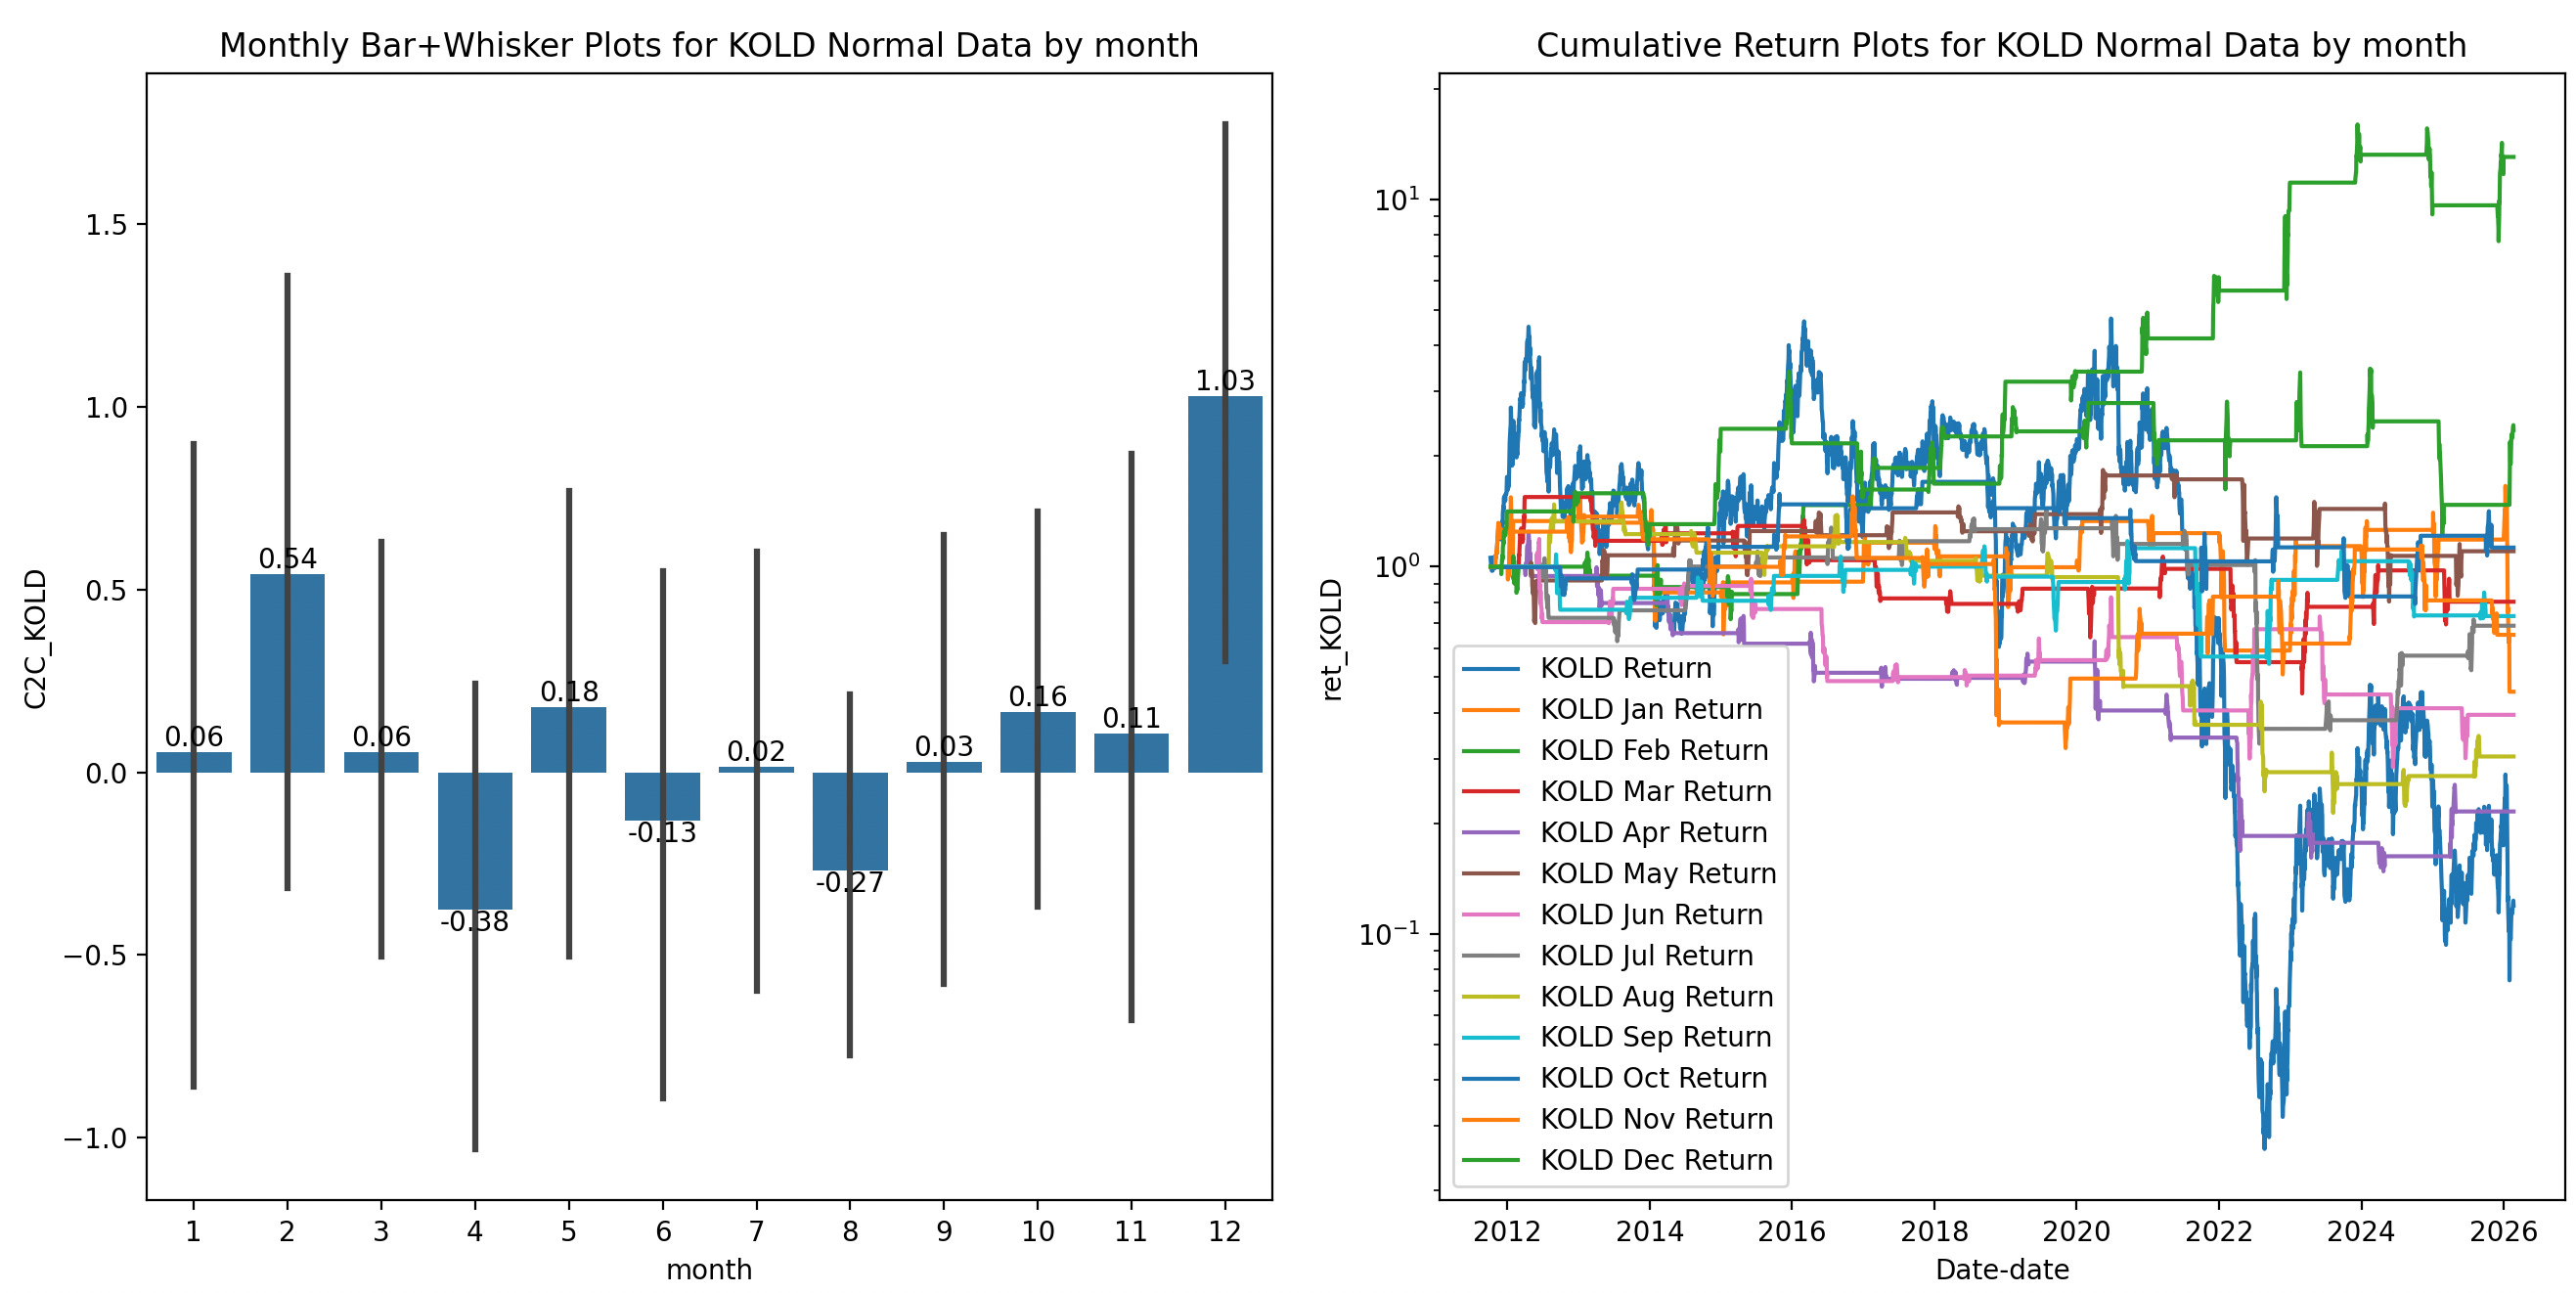
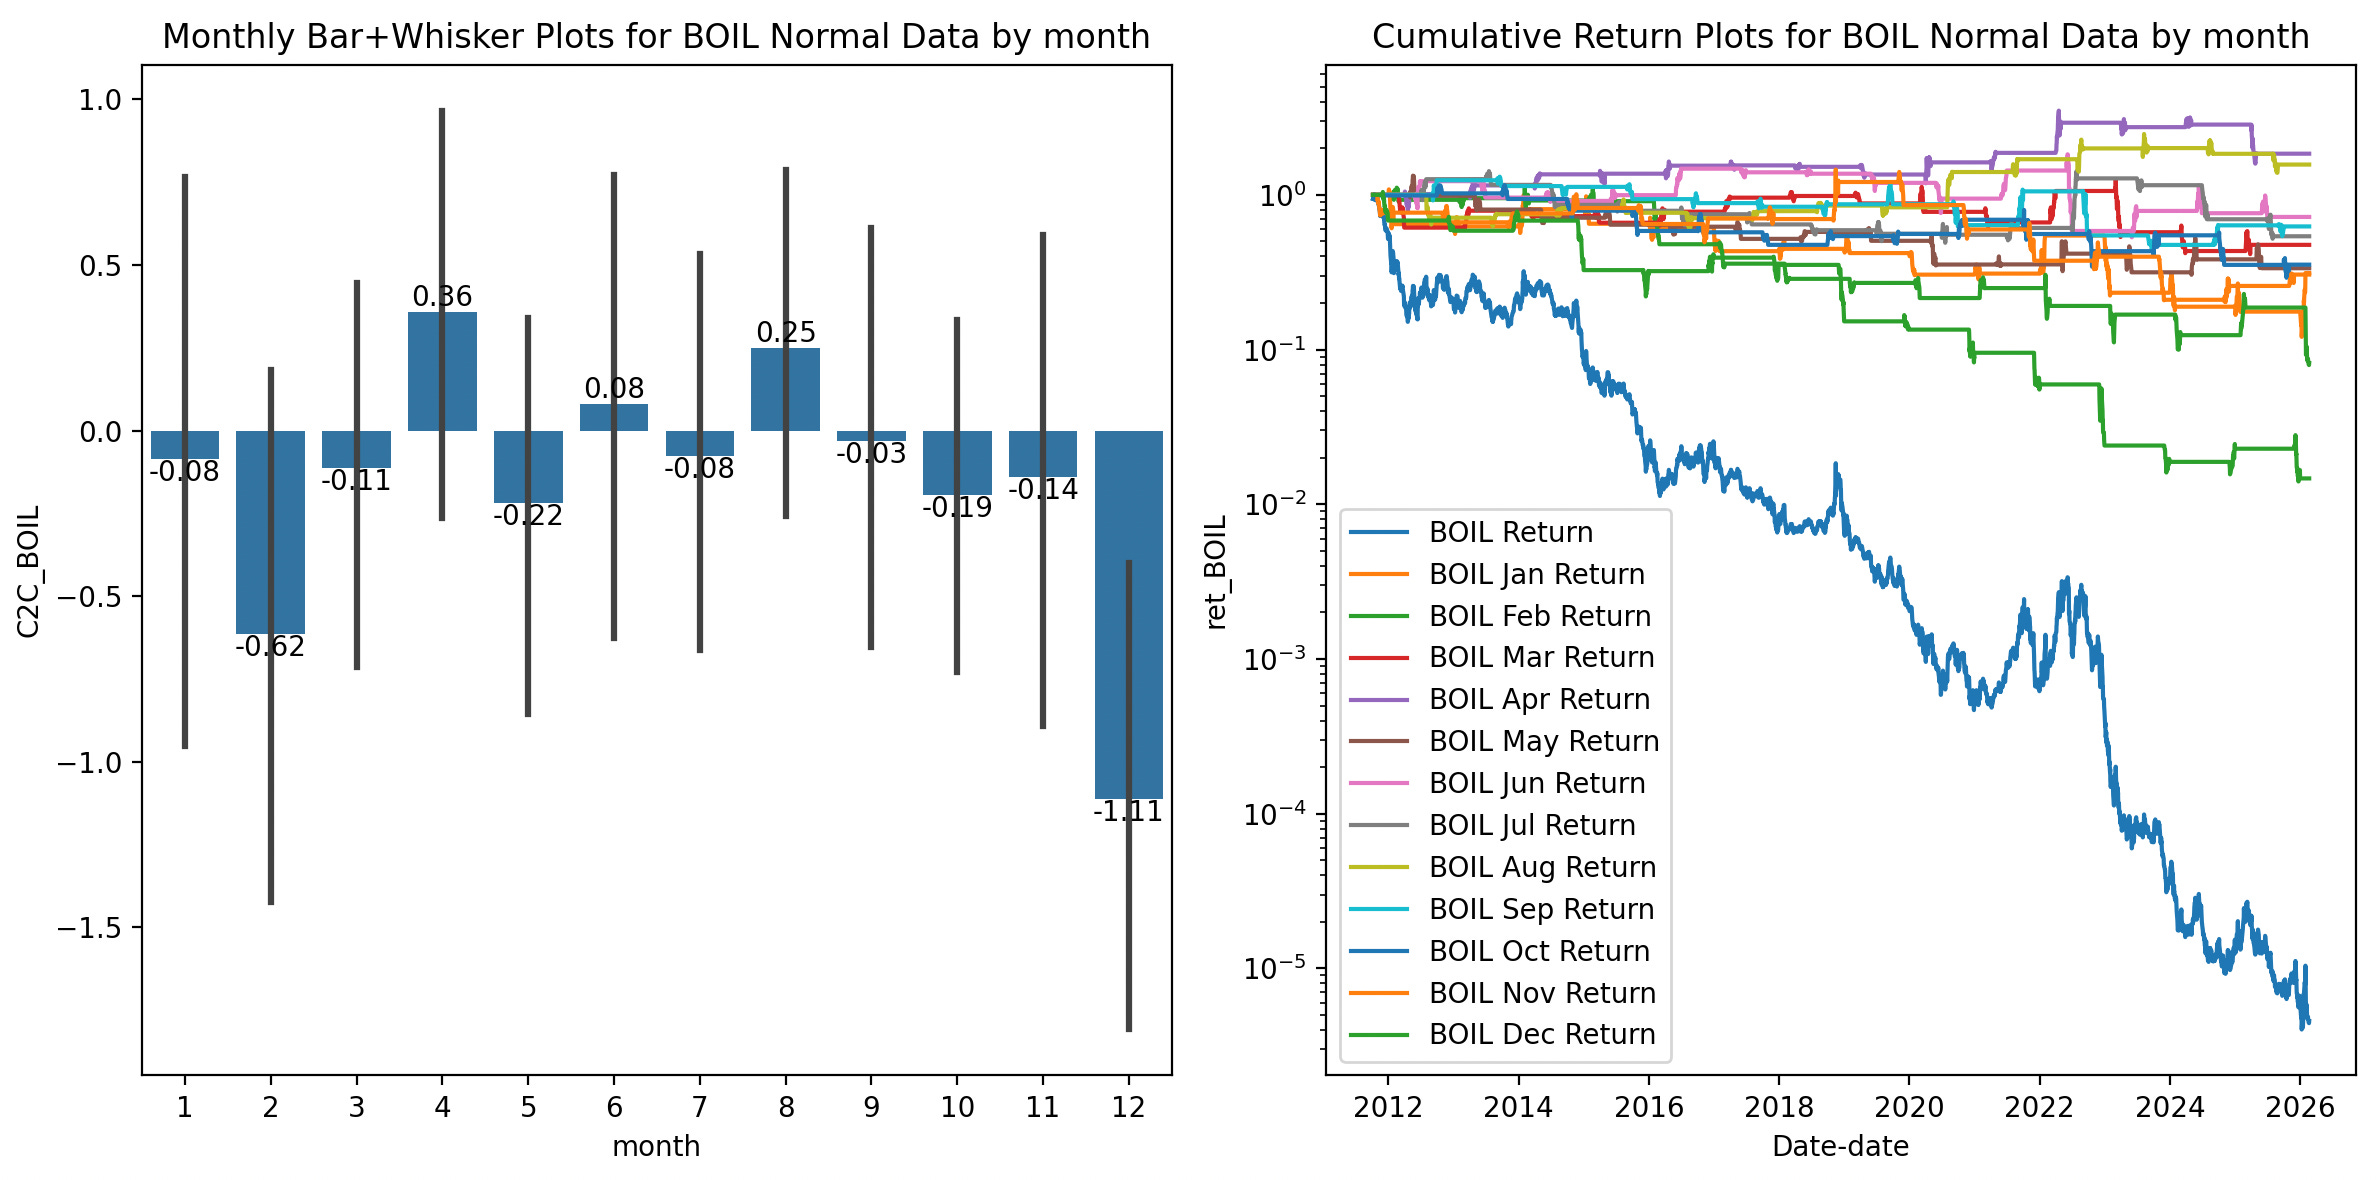
Look at how steep the return for KOLD is in December on the left bar chart! Look at how all the returns aren’t just lumped into one year’s outlier return on the right line chart!
From the limited data available, it appears that the best Natural Gas trading months are:
Long Natural Gas (Long BOIL, or Short KOLD) in April. (And maybe August…)
Short Natural Gas (Long KOLD, or Short BOIL) in December. (And maybe February…)
And that makes sense, right? Market participants bid up prices as Winter approaches, Then as Winter ends, the futures get pushed back down. It’s volatile, but the logic makes sense.
We have 2-3 months where it has historically been profitable to Long or Short this commodity, since like... 2012. (I believe this can also be confirmed with Natural Gas futures themselves, the underlying security for these ETFs) So I figured... Surely there’s other commodities and ETFs that work on this monthly basis?

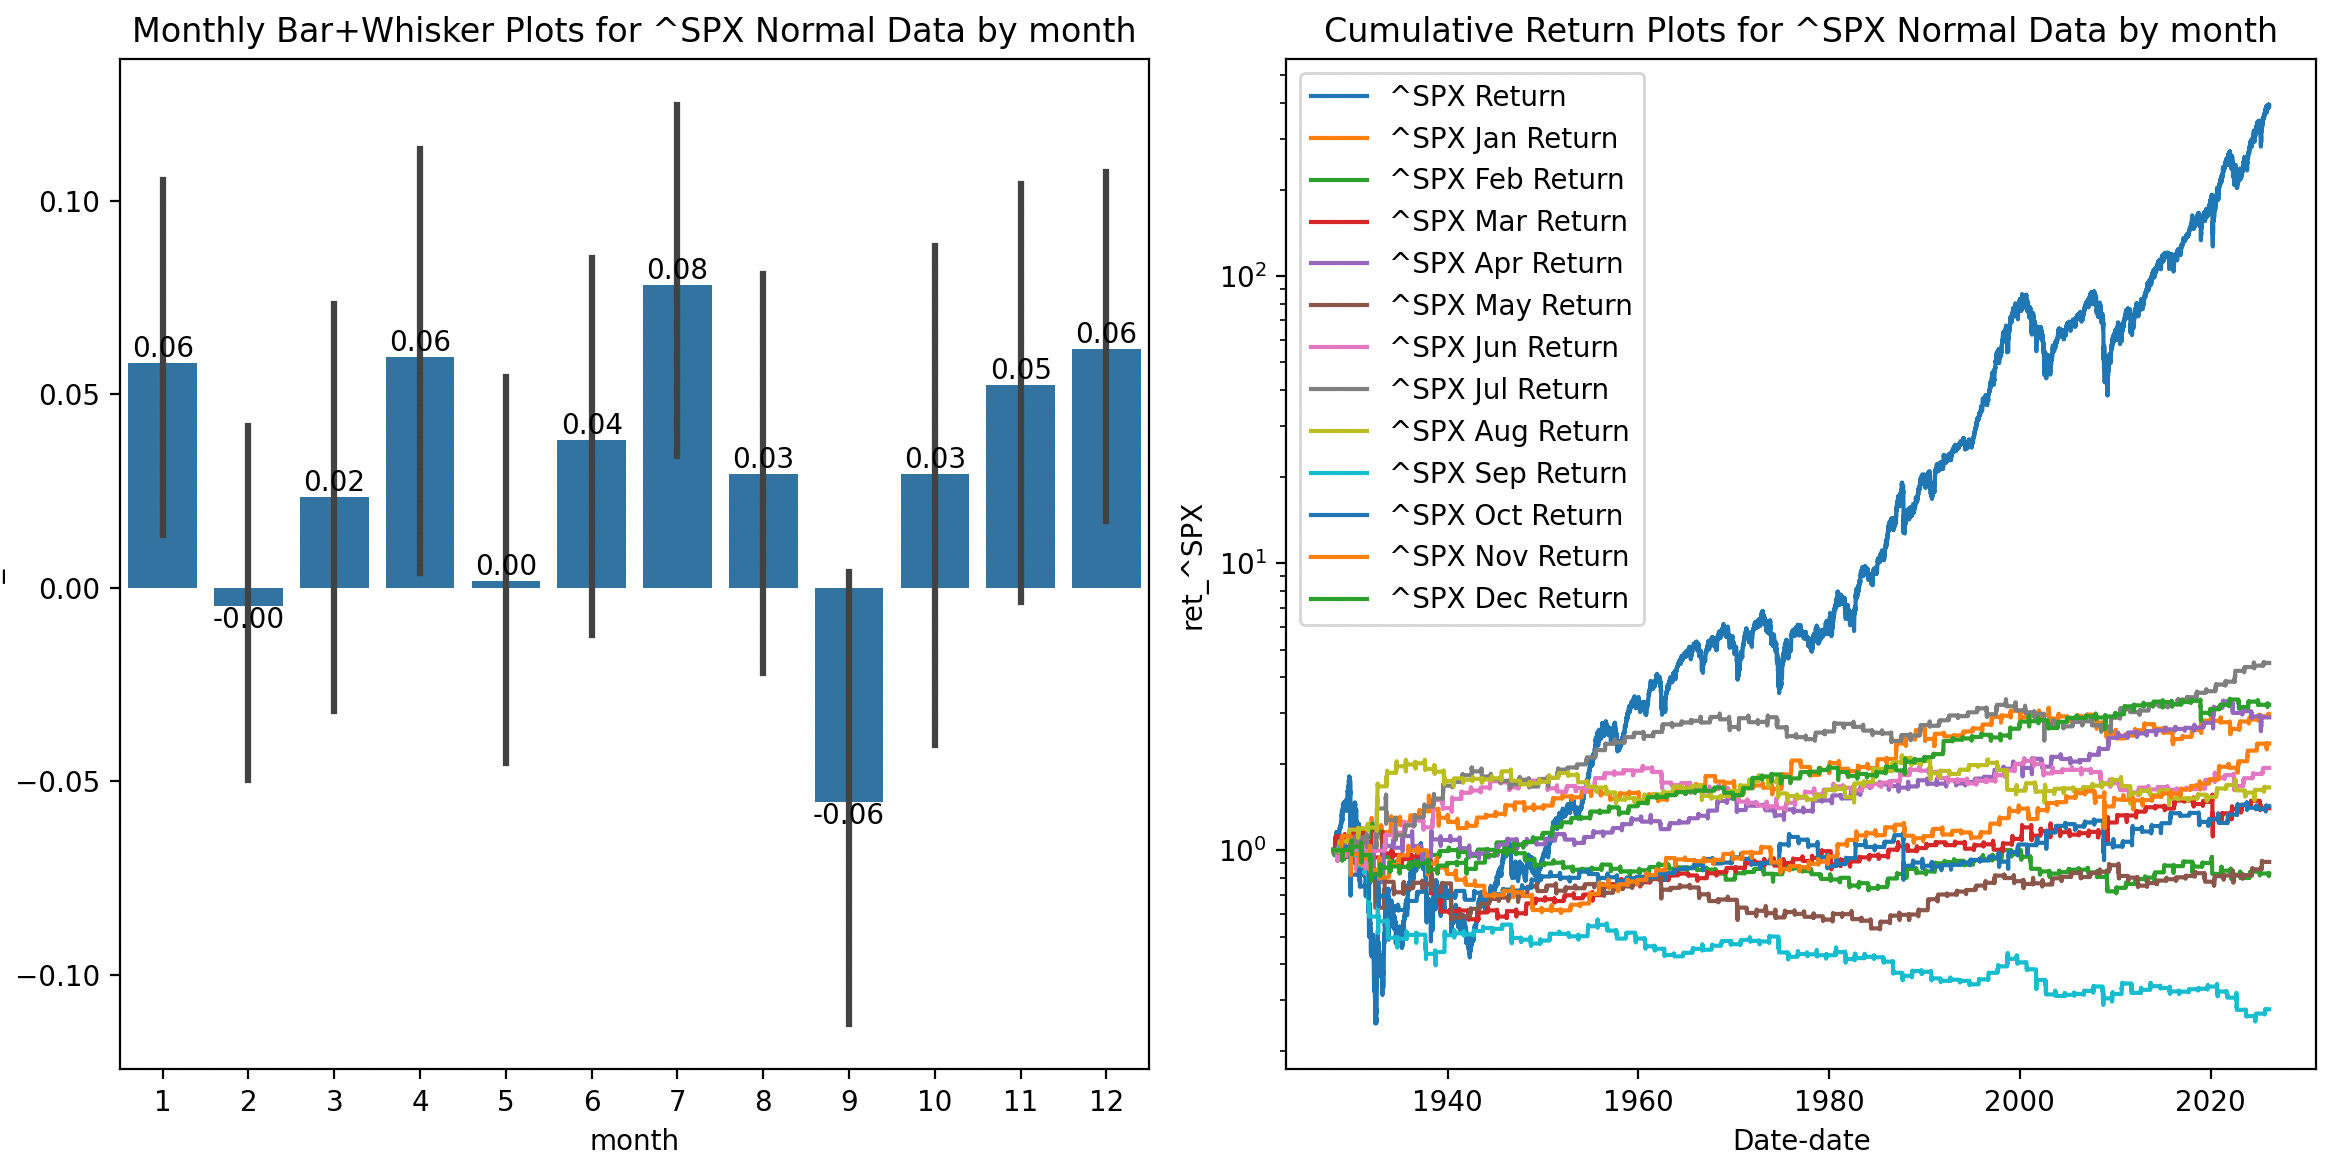
Side note on the S&P Itself:
This isn’t something I can trade with ETFs since the per-day move is only about 6 basis points on SPX or a SPY ETF, but September has been a terrible month for the markets since at least the 1920’s. I’d have to see if the pricing makes it viable, but a 1-month bear call spread with SPX options could be worth researching later in an update.
In fact, finding any Commodity ETF that did well in September was difficult. I had to get creative…
The Commodity Calendar
I now present “The Commodity Calendar Trade”.
There are multiple commodities with ETFs containing the futures or underlying items, and several of them are even leveraged or inverse-leveraged ETFs. These commodities should have long-term trends that we can exploit.
Note: Robot Wealth does suggest that shorting a leveraged ETF is more attractive than longing the inverse, but I’ve always had trouble shorting, so we’ll just stick with boring old ‘Long ETFs’ for now.
The Commodity Calendar Basic strategy is:
Buy the commodity’s appropriate ETF at the close of the last day of the prior month. For instance, if Natural Gas is to be shorted in December, buy KOLD the last trading day of November.
Sell that ETF at the end of the last trading day of the month.
This is a very simple trade with 12 ETF buys and 12 ETF sales per year, and like the Volatility Event Calendar it can be planned well in advance. Uncomplicated, logical, and it only needs 2 brain cells to rub together. Perfect for me.
…I haven’t mentioned which commodities yet, though. Because I clearly wasn’t satisfied with a simple system.
More, Delicious Leverage
A lot of these 1x ETFs have 2x-3x leveraged versions. If we can figure out the most likely days for the returns to be positive, we can decrease our portfolio exposure time, decrease the volatility drag of 2x-3x ETFs, and possibly even make more money than we would just holding 1x ETFs. What could go wrong? Natural Gas prices going up 50% overnight and wiping out oodles of futures traders and any -2X ETF holder? Has that happened before?

Yes. But it’s not like this strategy is using 100% of my portfolio, and trading has risk, so I’ll move on.
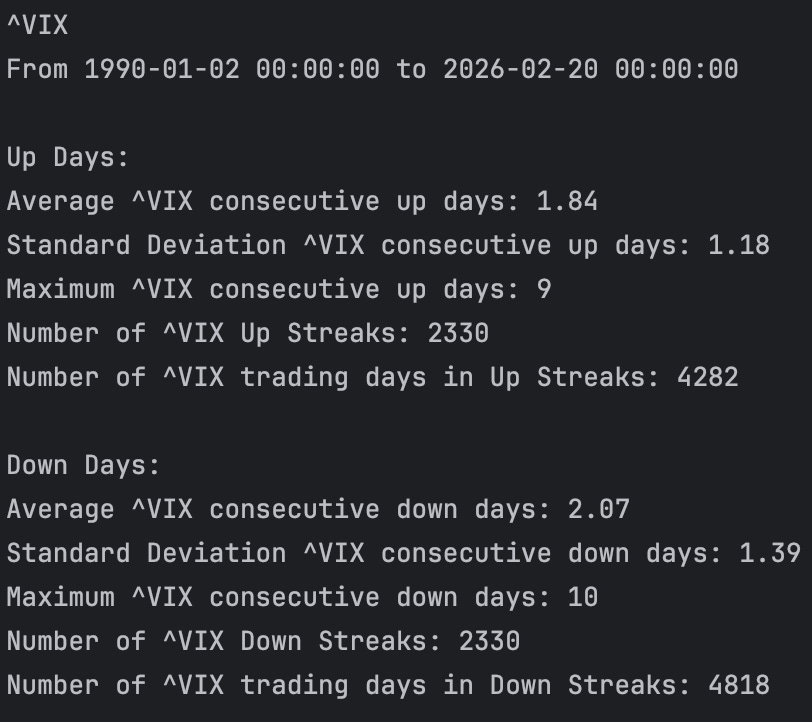
As it turns out, the VIX or the S&P 500 Index are great indicators of sentiment. Checking VIX/SPX’s move Up or Down from the prior day’s close works well for what I’d call “bullish” vs “bearish” trades. Market risk on vs off, as another way to think of it.
I did quick investigation of the number of consecutive days the VIX or SPX will move in the same direction, and it’s not very high. Holding a 2-3X ETF for 2-4 days is more palatable than holding for 30.
Some Commodities respond very well to risk-on or risk-off moves in the market. Remember the previous KOLD returns chart? Look at what happens when you only hold KOLD if the VIX is down the prior trading day. And it’s not just raw returns, the Sharpe jumps as well.
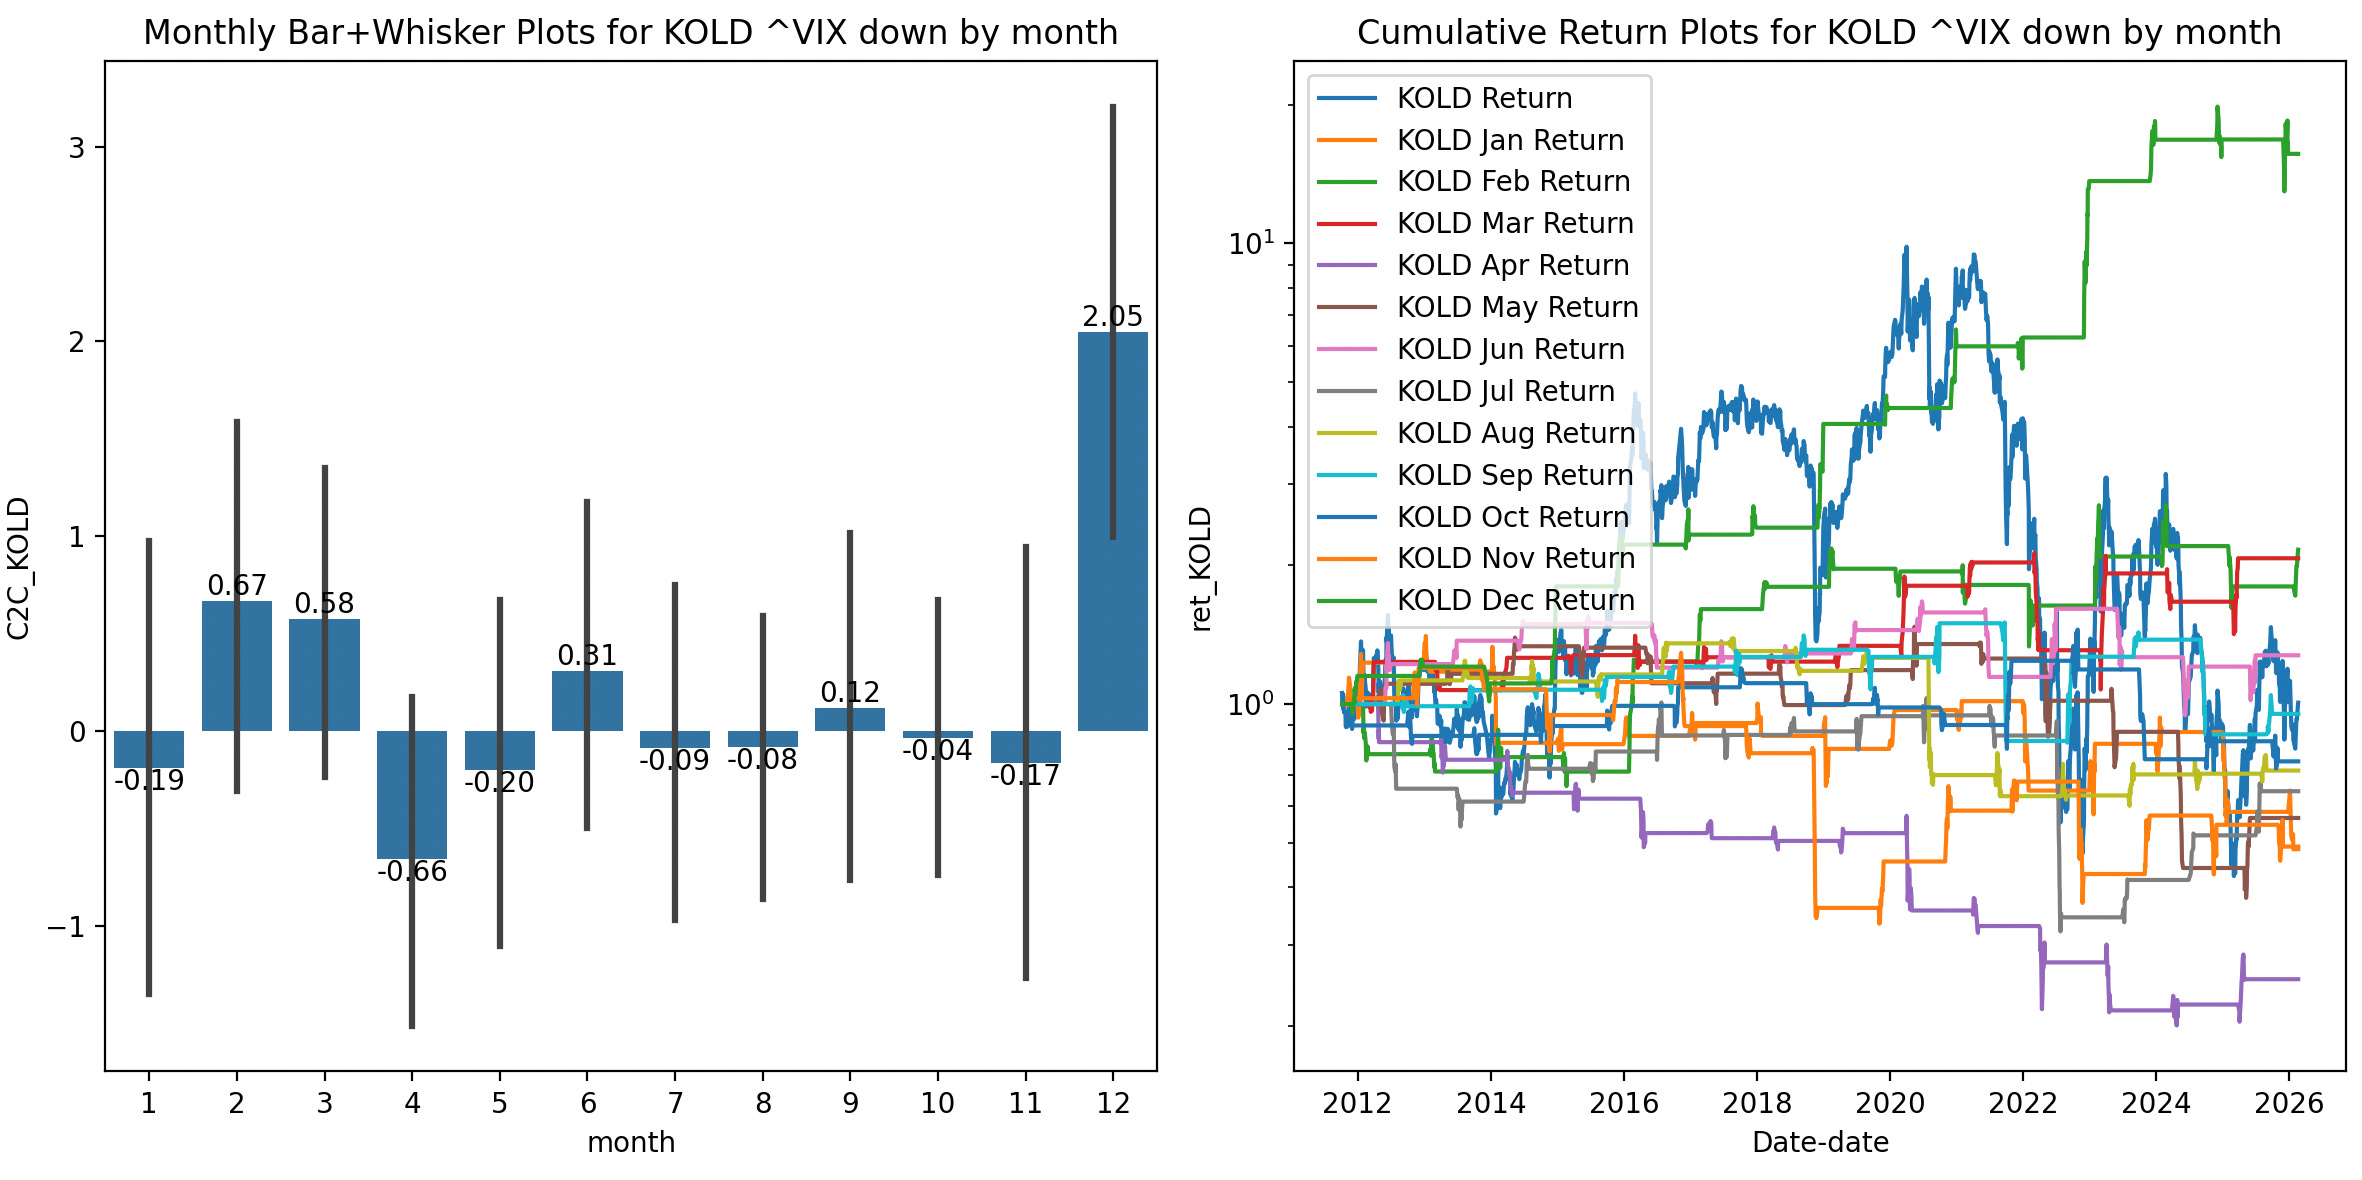
Average daily returns of 2% while invested in December! And the chart since KOLD’s inception shows that not all the gains were in a single year, yet again. Pretty sick.
Here’s what happens when you only hold CORN if the VIX is up the prior trading day.
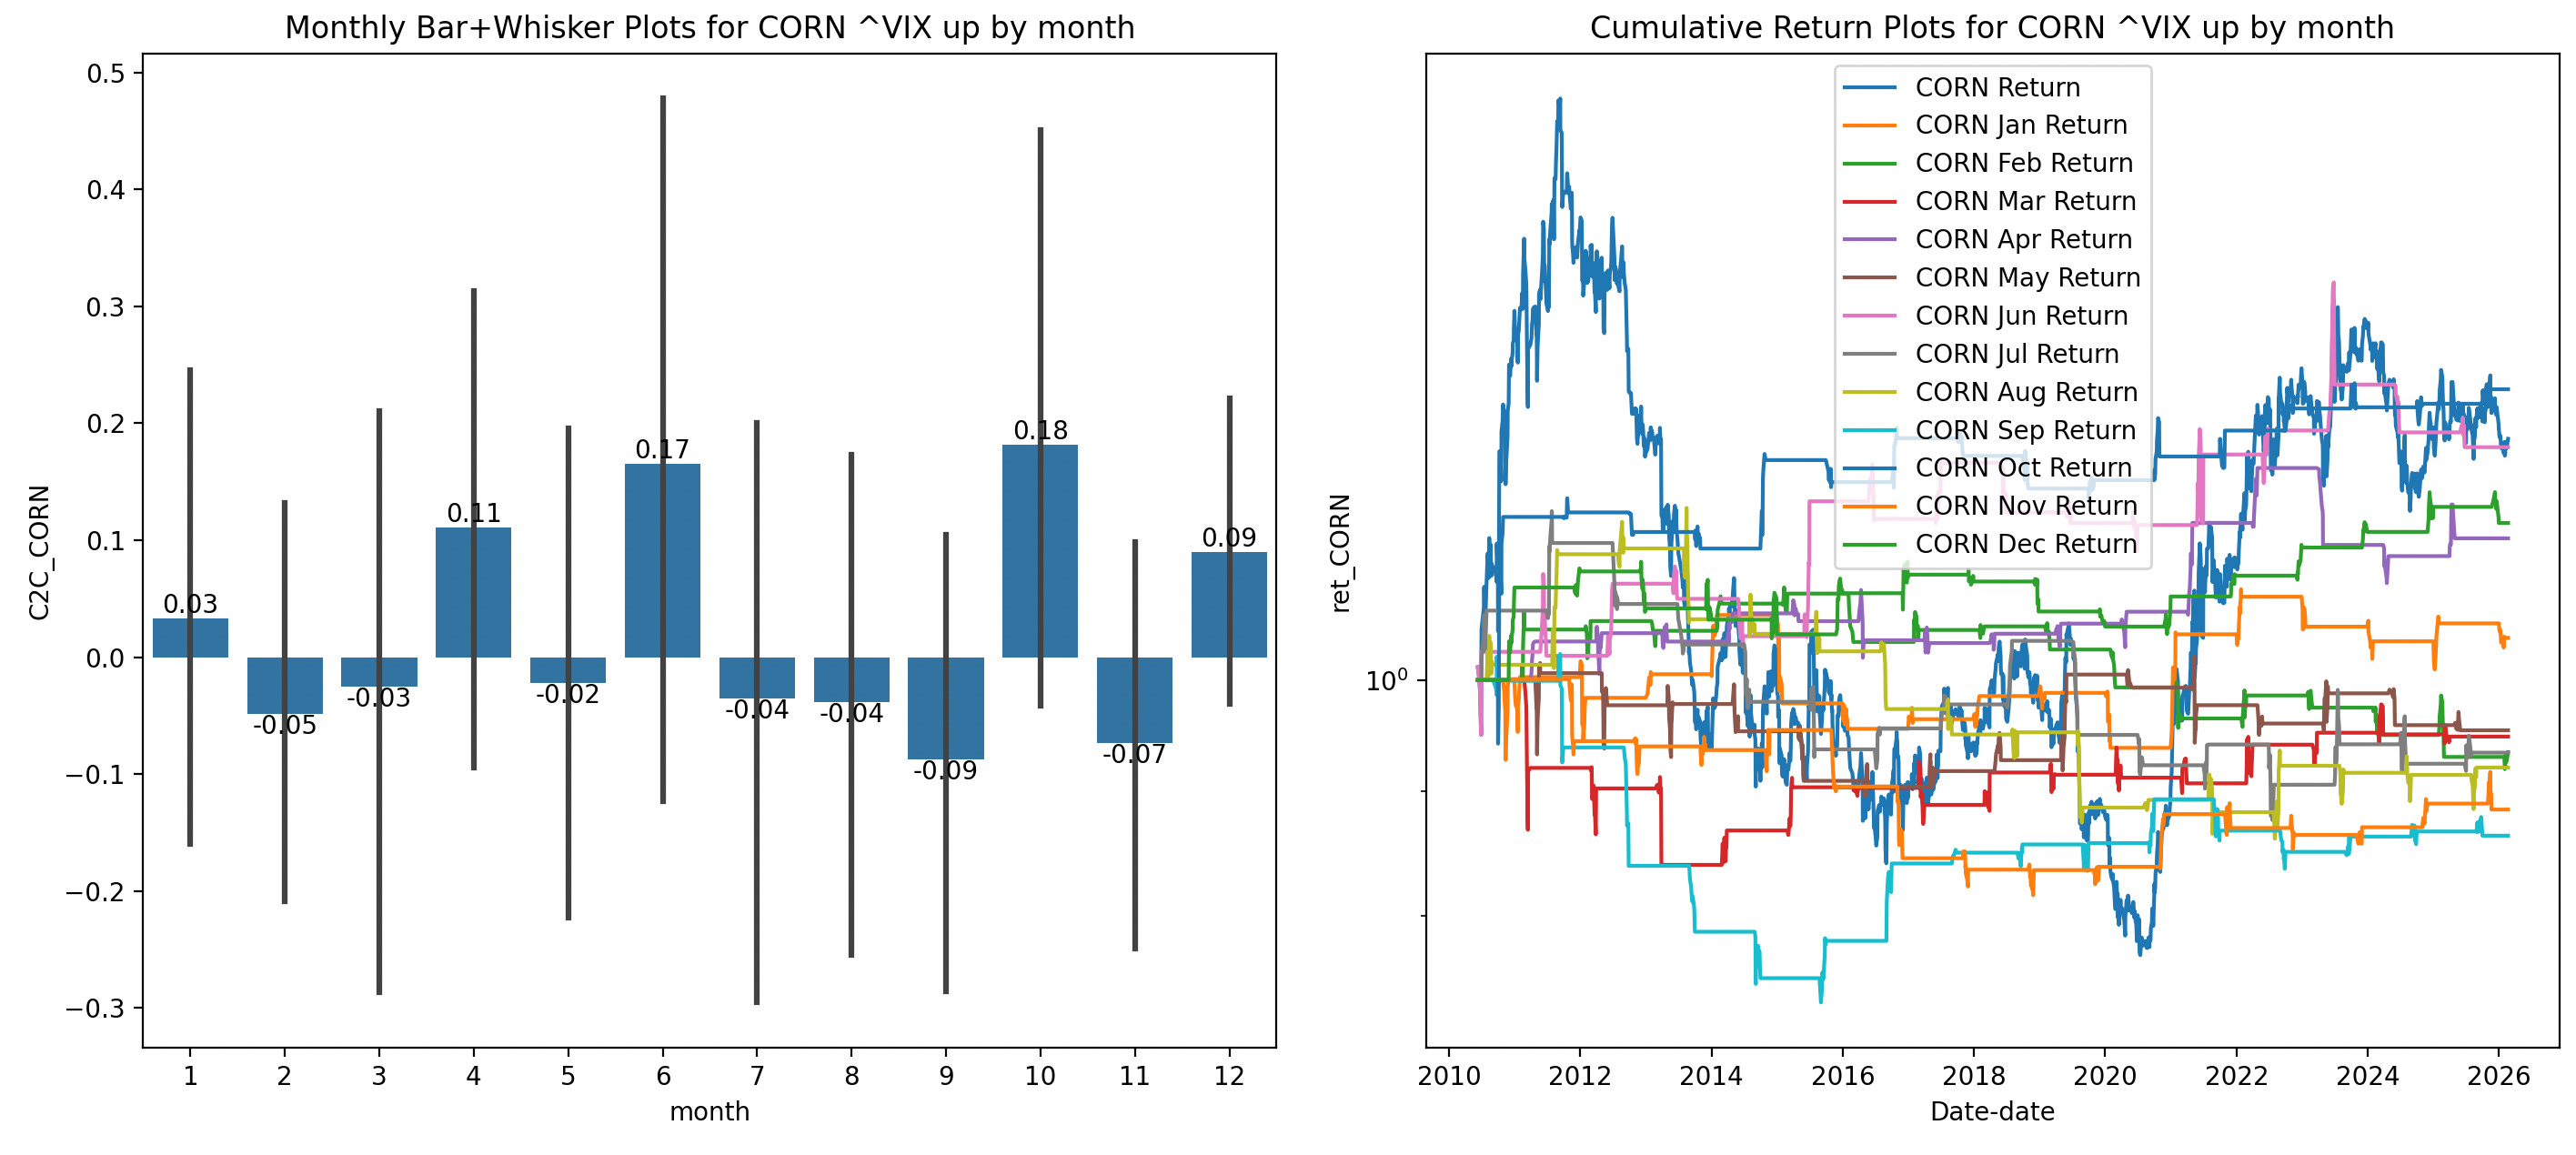
October (not June, notice June has weird price spikes) CORN returns are good when Corn prices spike late in the year, which appears to be tied to increase in volatility in the general market. Market panics, corn prices go up late in the harvest season in response? Seems like a decent logical leap.

After some consideration I think that the general rule for these futures trades is the following:
Metals will react to rebalancing or bullish markets, so Palladium, Gold, Silver, etc do well in the month or day after good equity returns. (GLD just so happens to have positive average returns on January, April, July, and October, the first month of each quarter…)
Agriculture prices going up early in a harvest time is a bullish economic sign, but when they’re up late in the harvest it’s bearish.
Oil and natural gas respond to winter like agriculture responds to harvests. Oil prices respond better to panics, so they’re risk-on. Natural gas responds better to normal economic conditions, so it’s risk off. Natural Gas also gets a bit of a bump in August as the market heads into winter.
Volatility markets (VX futures) do well in early summer months. This is a historical trend, according to traders. I assume it’s because people just don’t want to worry about their stocks during the summer? I’m going to avoid using Volatility ETFs for this trade because they’re so good it’s like cheating at this point. I’ve already got a few strategies that use Volatility ETFs, like the Monday Vol, Volatility Reversion, and Event Vol Playbook strategies.
So what does the VIX-Aware Commodity Calendar Trade Look like?
Not every commodity is going to rely on the VIX’s position. Gold, for instance, does better with the SPX’s movement than VIX’s, but that’s an effect I’ve already discussed in my [GLD Option trade] post. These ETFs should hopefully be liquid enough to buy and sell easily. GLD, BOIL, and KOLD, the major sources of this trade’s return, are very liquid, with large daily volume and small bid/ask spreads.
January: Long Gold (GLD, UGL the 2X LETF, or SHNY the 3X LETF)
VIX-Aware When: SPX moves > 0 the prior trading day.
February: Long Gasoline UGA
VIX-Aware When: VIX moves < 0 the prior trading day.
March: Long Utilities XLU, ( or UTSL, the 3X LETF, Utilities count as Commodities right?…)
VIX-Aware When: VIX moves > 0 the prior trading day.
April: Long Natural Gas (UNG, BOIL, the 2X LETF)
VIX-Aware When VIX moves < 0 the prior trading day.
May: Long UGA (also, long SVXY/SVIX works.)
VIX-Aware When VIX moves < 0 the prior trading day.
June: Long Oil (USO, UCO, the 2X LETF)
VIX-Aware When VIX moves > 0 the prior trading day.
July: Long Palladium (PALL) (long SVXY/SVIX, or GLD/SLV works too)
VIX-Aware When SPX moves > 0 the prior trading day.
August: Long BOIL (or Long TLT or TMF the TLT 3X LETF when VIX moves < 0 the prior trading day)
VIX-Aware When VIX moves > 0 the prior trading day.
September: Long Sugar CANE( Or Long Uranium UX*/URNM)
VIX-Aware When VIX moves > 0 the prior trading day.
October: Long Corn (CORN, CXRN the 2X LETF)
VIX-Aware When VIX moves > 0 the prior trading day.
November: Short Oil (Long SCO, the 2X LETF)
VIX-Aware When VIX moves > 0 the prior trading day.
December: Short Natural Gas (KOLD, the 2X LETF)
VIX-Aware When VIX moves < 0 the prior trading day.
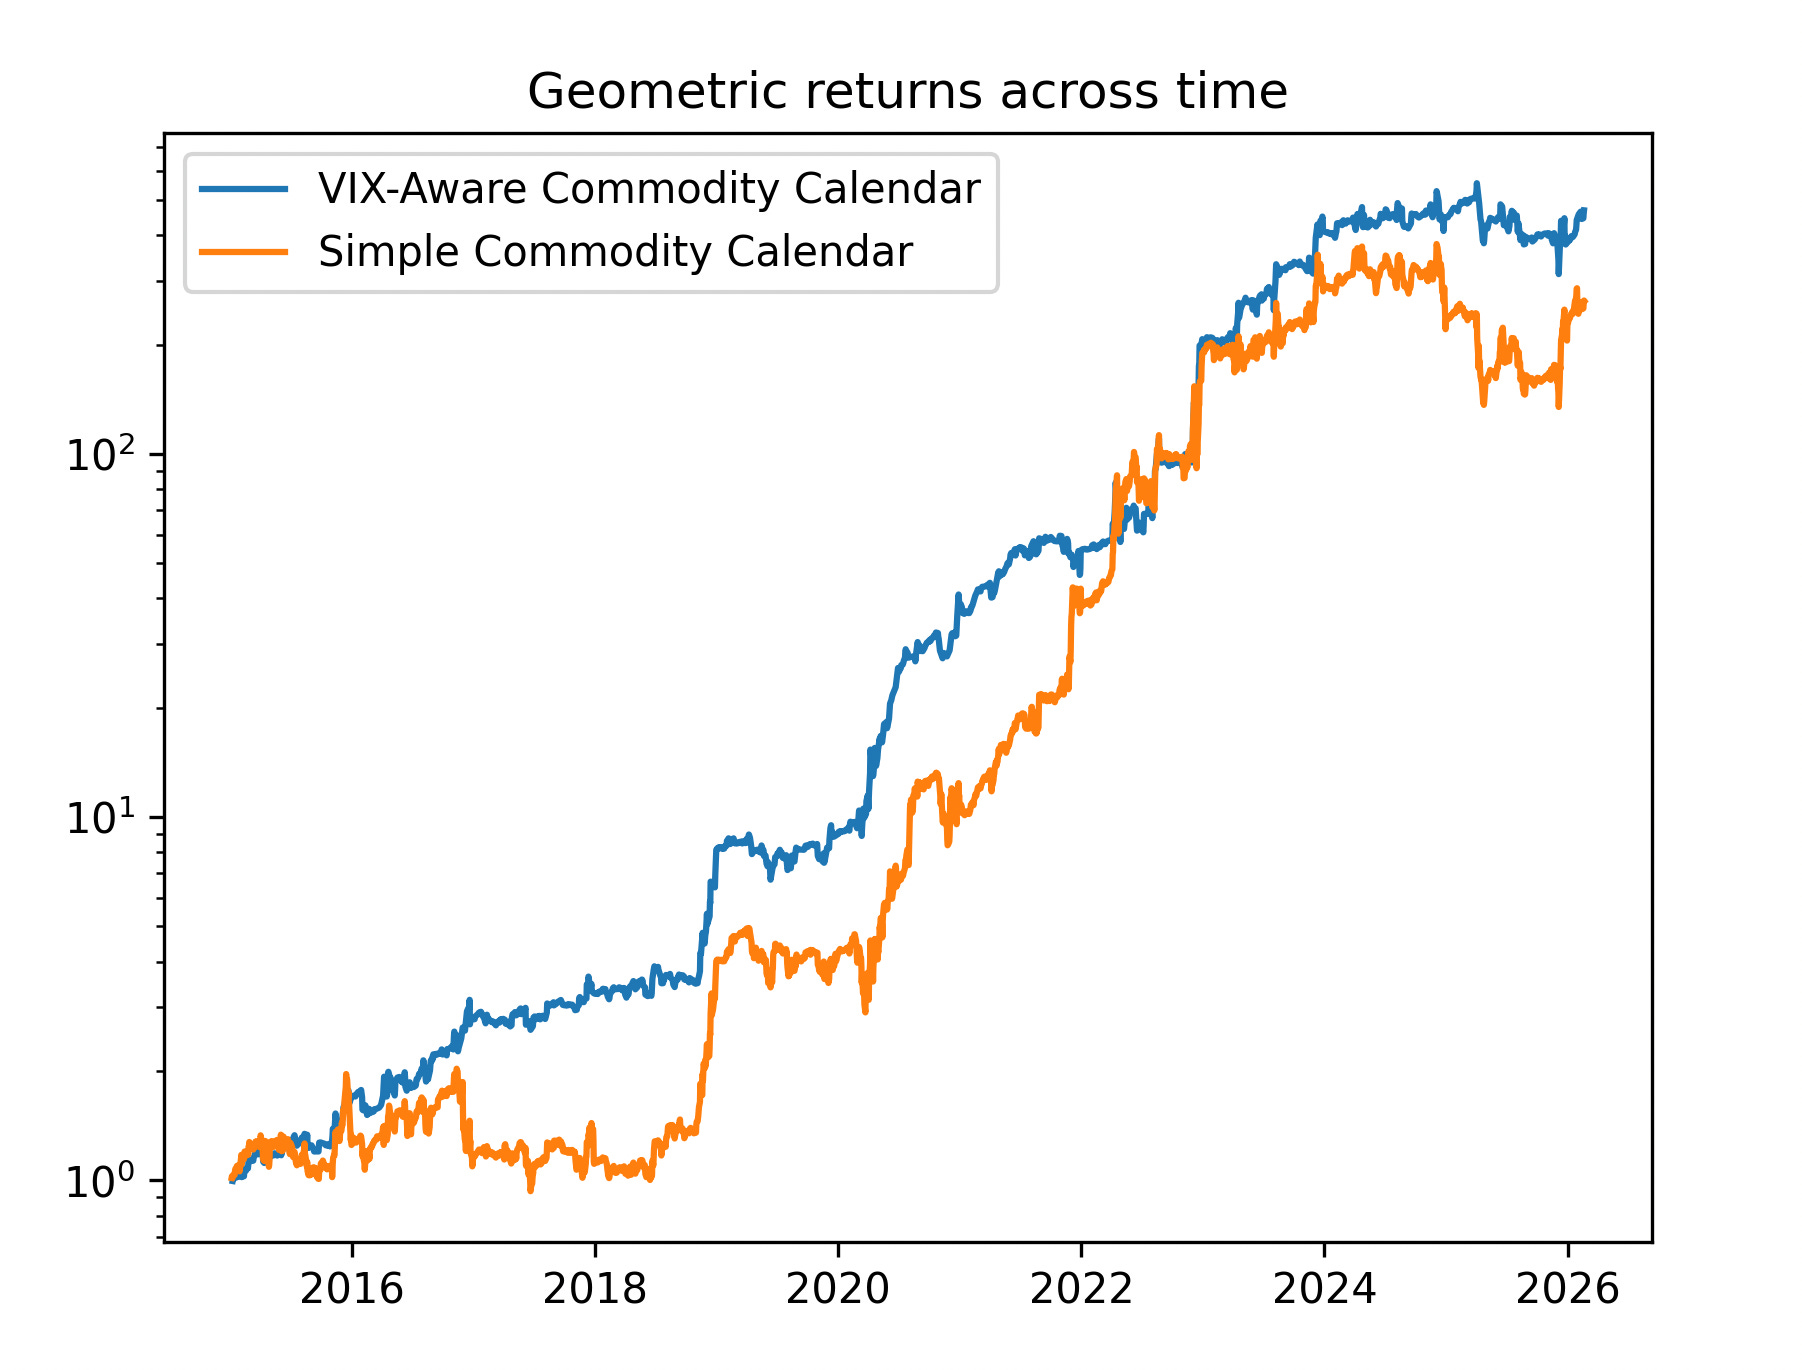
To be completely unrealistic and hopeful for simulated results, this is sort of what the chart looks like for Simple and VIX-aware Commodity Calendar trades since 2015 if you used your full portfolio to trade them. The Simple trading system usually has a Sharpe of roughly 1.1, while the VIX-aware system has a Sharpe of around 2.1. The Oil, Gasoline, and Natural Gas trades make up the bulk of the returns, mostly because they’re older ETFs, but this still looks like a pretty successful system all-around.
What? Uranium? You can trade that?
Admittedly, the Uranium in September trade is a bit shaky, but it’s one of the few decent September trades I could find. I’ll try trading it at least once, but I won’t blame anyone else for writing it off as crazy or trading CANE instead. The UX Uranium ETF appears to be new, and while there are URA and URNM Uranium Industry ETFs, this is not a particularly large or liquid market. UX itself seems to only have a ~$4M market cap.
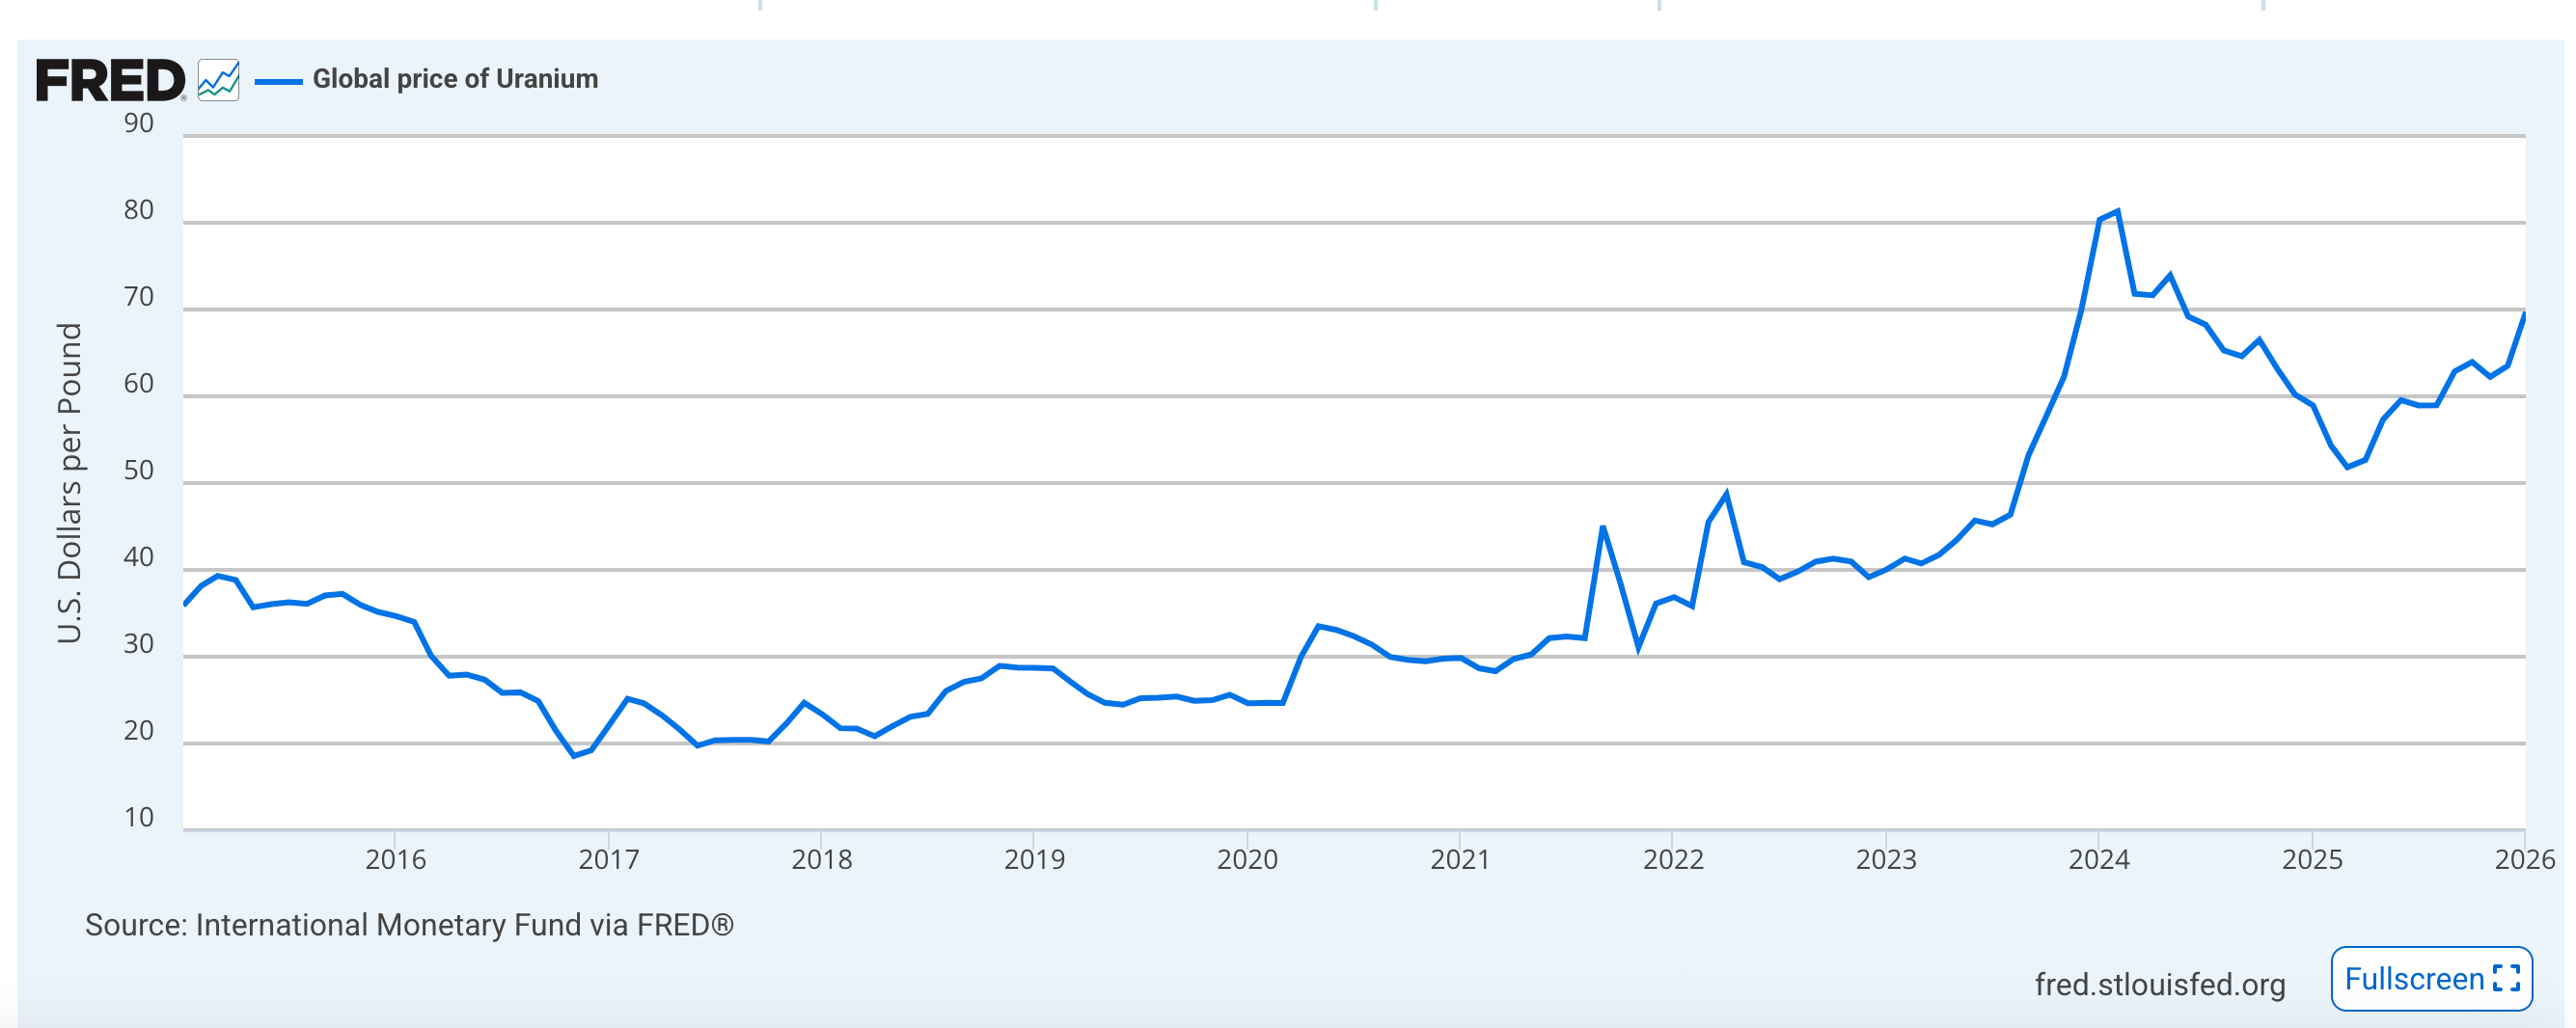
In an attempt to get more price data on Uranium, I took a look at the Federal Reserve’s time series of Uranium spot prices, and it seems that September has the highest returns since 2015, (62% arithmetic total return, ~5% average September returns) and only 3 years of down September returns.
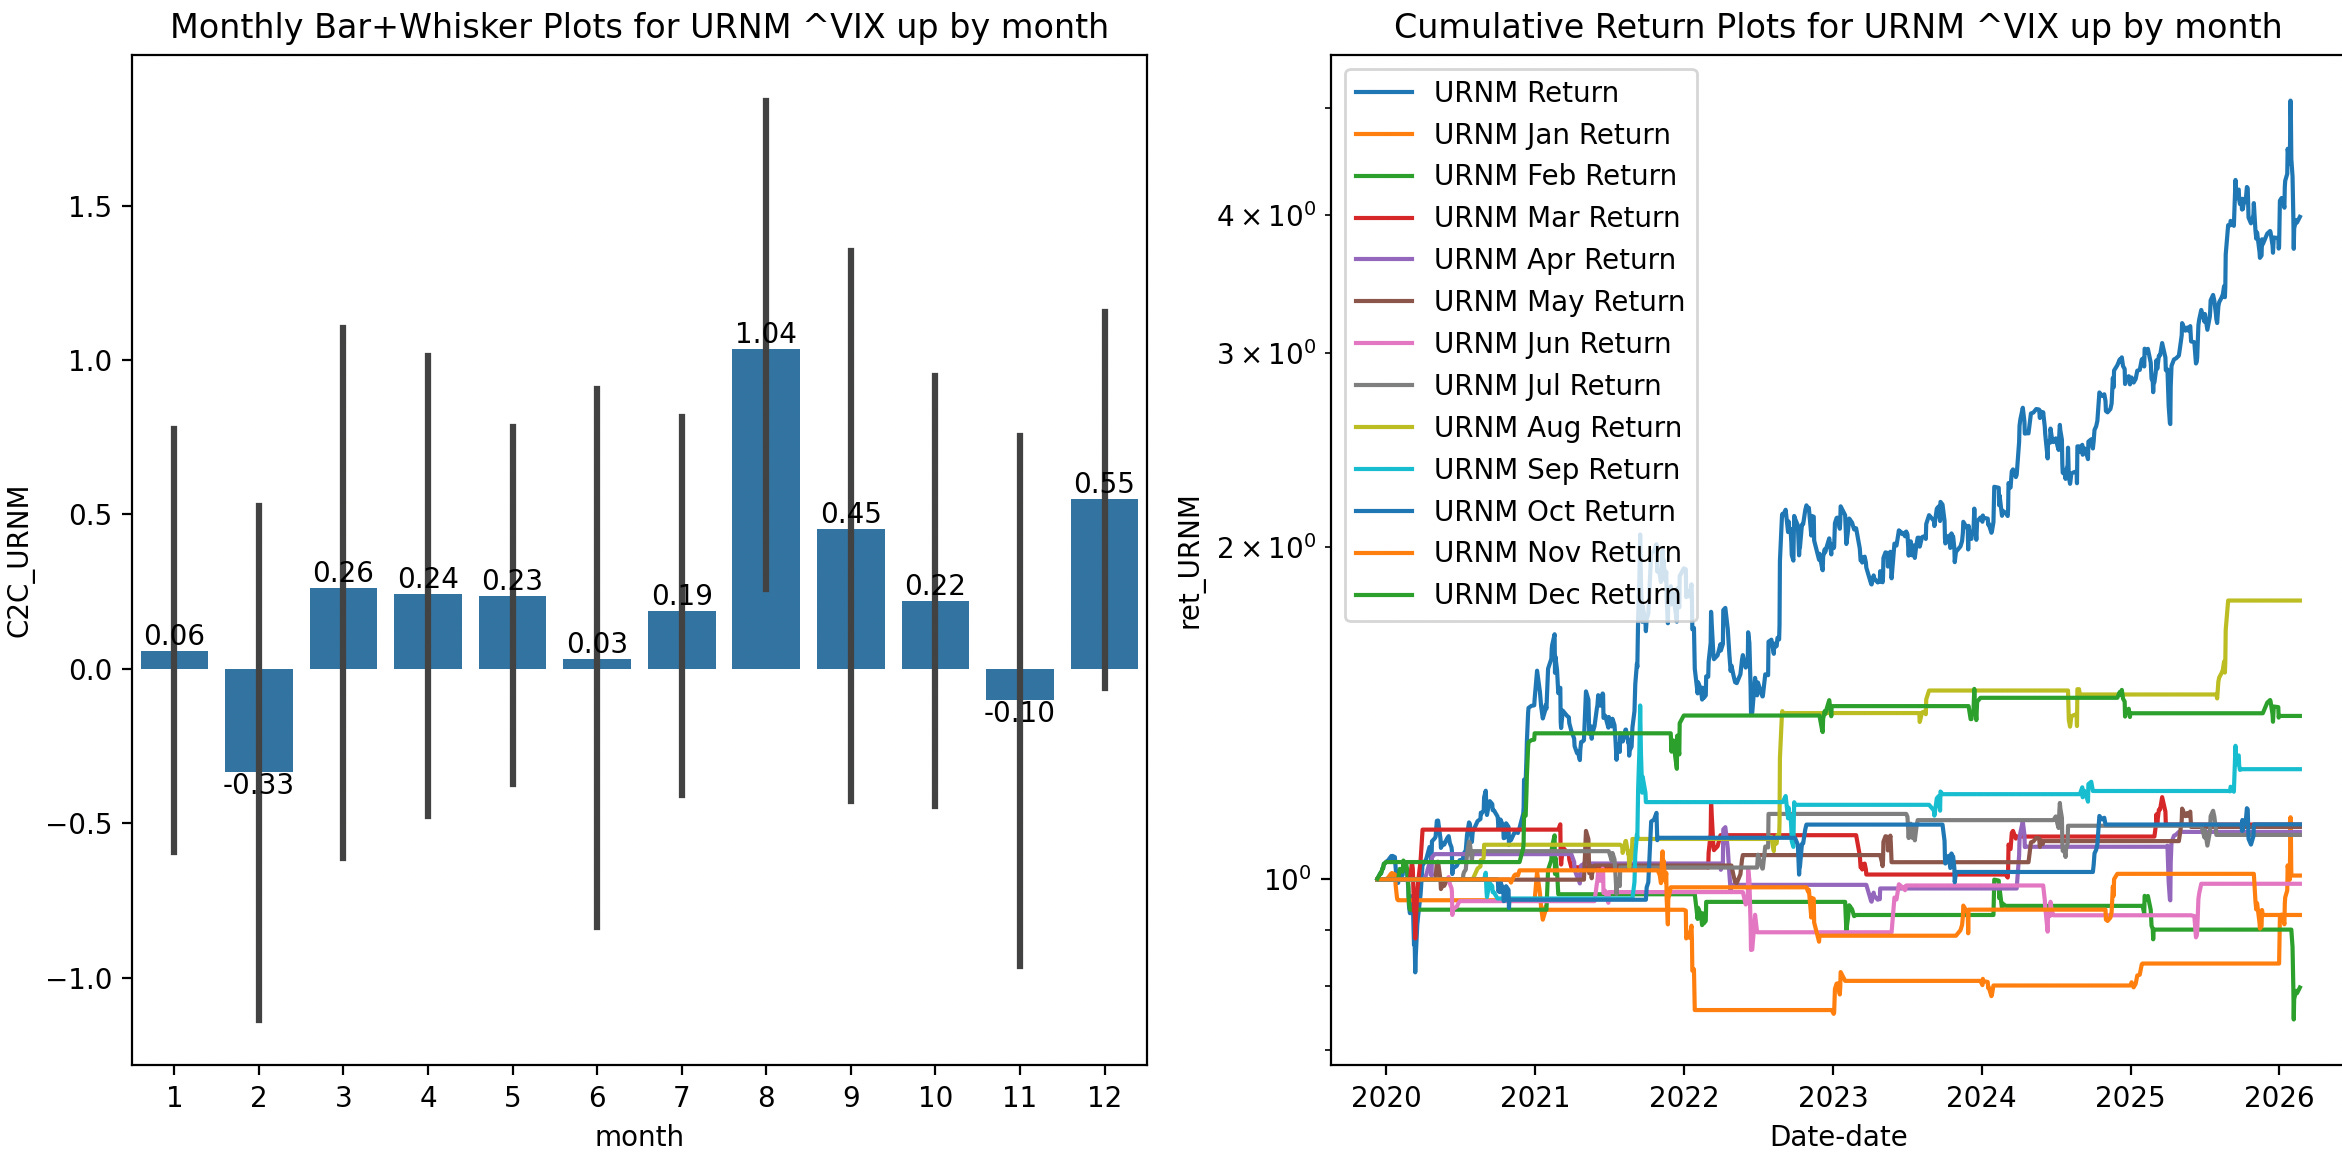
URNM has decent returns in August and September when the VIX is up the day prior, but there aren’t as many years as XLU or UNG to compare. So this remains a highly speculative strategy.
Results so Far:
I’ve tried the Commodity Calendar strategy out so far in both modes, Simple and VIX-Aware (risk on/off), in a rough 5-10% position. In January I bought and held UGL the whole month, and in February, I’ve been trading UGA by being long when VIX is down the day prior.
Here are the results so far:
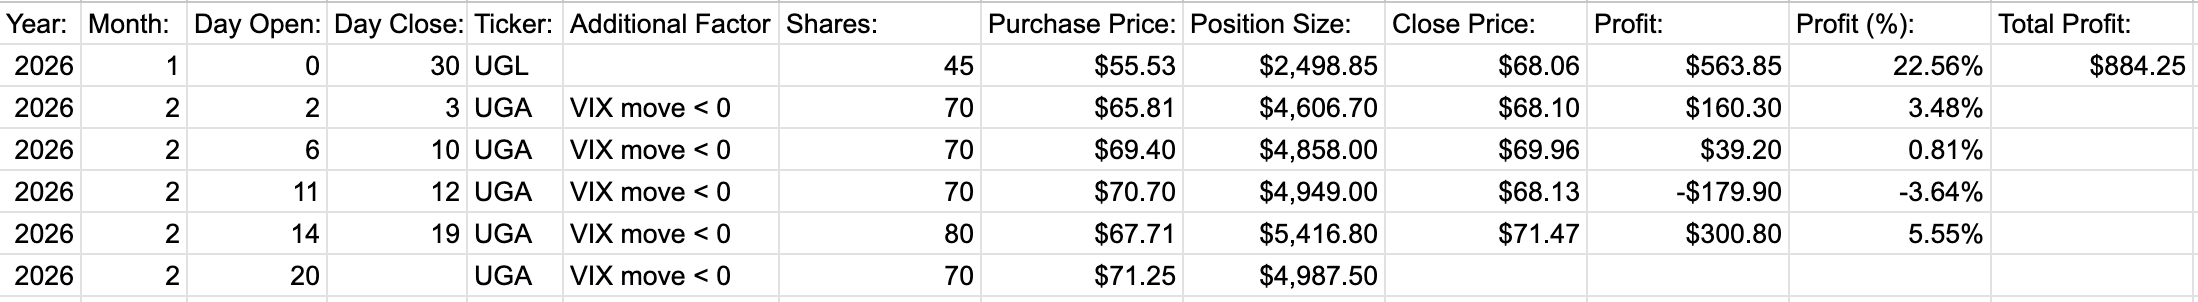
The UGL position I was holding was up something like 80% in January only to crash the last two days, which was horrifying to watch. Buying and holding leveraged ETFs is not for the faint of heart. The UGA position has been surprisingly easy to keep track of, since I only need to check the VIX’s move at end of day. So I think I’ll continue with the VIX-Aware Commodity Calendar trade going forward.

Code for the backtests and other analysis can be found here on Github. I’ll have the March 2026 Trading Update posted next weekend.
Thanks,
Lay Quant